You will be able to validate your attendance (Check-In to sessions) using your personal schedule.
Monday September 21, 2026 1:00pm - 3:00pm EDT
Speakers 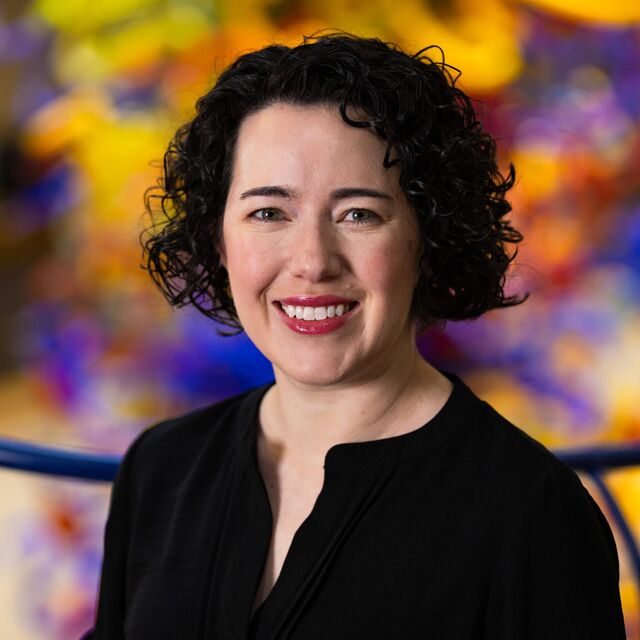
Research and Evaluation Associate
I have been part of the M-Team for over 15 years. I love helping the institution and my coworkers learn what is working for our constituents and where we can improve our experiences and practices to achieve our mission!
Monday September 21, 2026 1:00pm - 3:00pm EDT


 Add to your schedule to access the video stream


